


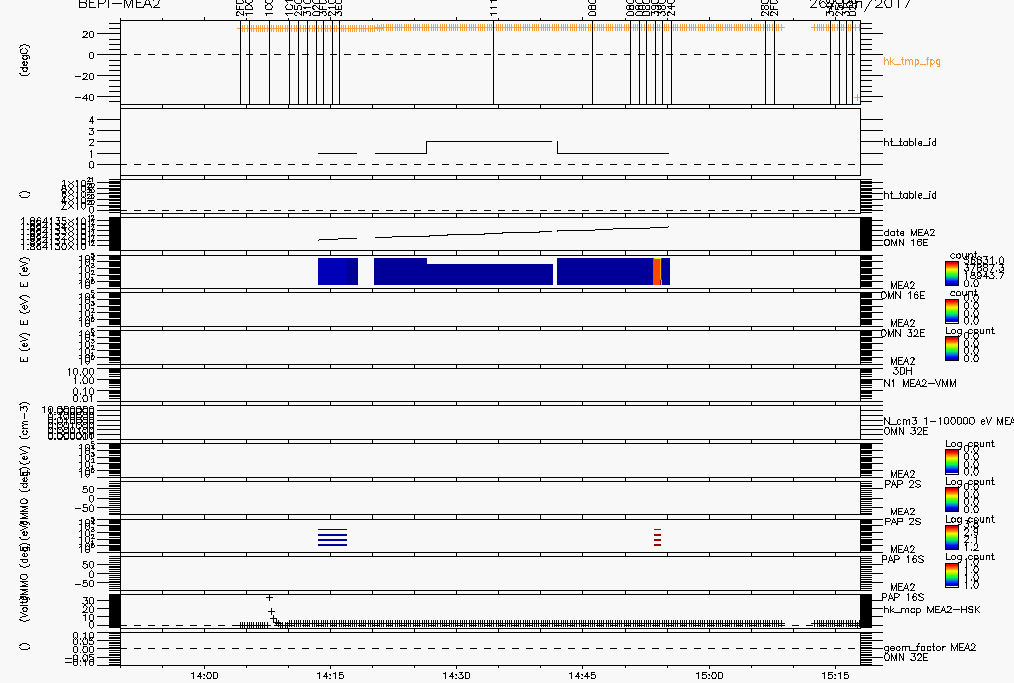
MEA2 data for 2017/01/26
We can see Energy table change on panel 2 : ht_table_id
Log file :
HK Commands :
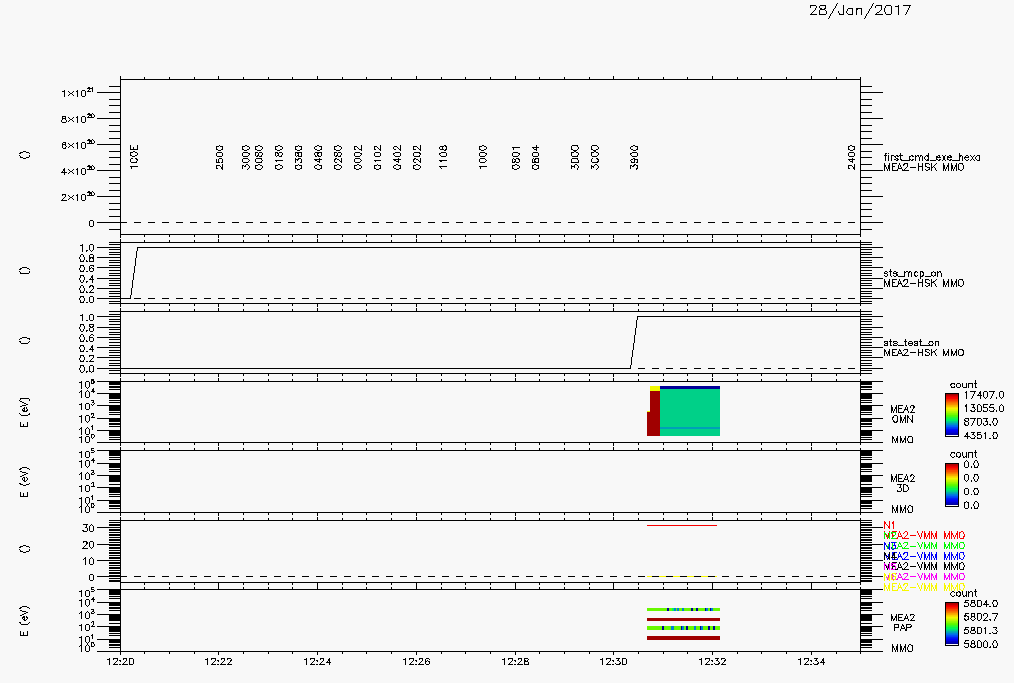
MEA2 data for 2017/01/28
Commands
Commands extracted from ME2 HSK data CDF L1 files, using variable first_cmd_exe
Next listing gives :
-
record number
-
time tag
-
command (hexadecimal)
R001374 2017-01-28 12:22:52.781250     0080
R001377 2017-01-28 12:23:16.781250     0180
R001380 2017-01-28 12:23:40.781250     0380
R001383 2017-01-28 12:24:04.781250     0480
R001386 2017-01-28 12:24:28.781250     0280
Obviously, there are no science data before 12:30, and we can’t see the energy table changes in the INFO data structure, because there are not science data in the telemetry before 12:30.
Full listing of available commands for this date :
Data plot
We can see in the following plot the HSK commands 0x180, 0x380, 0x480 and 0x280, from 12:22 up to 12:24.
The science data starts at ~12:30, and we can only find Etable = #1 in the INFO data structure.
Source code
The following source code is used to extract Energy table from the INFO data structure :
////////////////////////////////////////////////////////////////////////////////
//
//      INF data        8 bytes
//      --------
//      4 bytes         with and en# of Et-PAP : 6 bits x 5
//      1 byte          sc # of Et-PAP
//      1 byte          largest en# (2 * potential) used for VM cal
//      1 byte          energy # of sweep stopping
//      1 byte          energy table #
//
t_err   Parse_INF (byte_t * data)
{
        char *          fname = FNAME ("Parse_INF");
        t_err           error = OK;
        uint32_t        tmp;
        int             e;

        Message_log (1, fname, "INF : %s", Hex_dump (data, 8));

        // 32 bits => 6x5 = 30 bits + 2 bits unused (LSB)

        tmp = get_uint32 (data) >> 2;

        for (e = 0; e < 5; e++) {

                INF.energy_band [4-e] = tmp & 0x3F;
                tmp >>= 6;
        }

        Message_log (1, fname, "Energy bands = [%d, %d, %d, %d, %d]",
                INF.energy_band [0],
                INF.energy_band [1],
                INF.energy_band [2],
                INF.energy_band [3],
                INF.energy_band [4]);

        INF.sector_num   = data [4];
        INF.energy_pot   = data [5];
        INF.energy_stop  = data [6];
        INF.energy_table = data [7];

        Message_log (1, fname, "Energy Table = %d  VM pot = %d  Sweep Stop = %d  PAP Sector = %d",
                INF.energy_table,
                INF.energy_pot,
                INF.energy_stop,
                INF.sector_num);

EXIT:   return error;
}
The following line are extracted from the log file.
They show the energy table information for the first 3 INFO data structure available :
TIME (HDR)   : 2017-01-28T12:30:40.396484352
HDR : M2 GF8
Energy bands = [0, 9, 15, 21, 27]
Energy Table = 1  VM pot = 32  Sweep Stop = 32  PAP Sector = 0

TIME (HDR)   : 2017-01-28T12:30:56.949218752
HDR : M2 GF8
Energy bands = [0, 9, 15, 21, 27]
Energy Table = 1  VM pot = 32  Sweep Stop = 32  PAP Sector = 0

TIME (HDR)   : 2017-01-28T12:31:09.363281280
HDR : M2 GF8
Packet Number : 1 Mode_64 = 0
INF : 00 93 D5 6C 00 20 20 01
Energy bands = [0, 9, 15, 21, 27]
Energy Table = 1  VM pot = 32  Sweep Stop = 32  PAP Sector = 0