


Object
Synchronization of time-tags given in procedures (.cml) and time-tags found in HK data.
Origin of time-tags for a given day has to be fixed in an external parameter file :
/DATA/BEPI/DATA/RESETS.txtAfter some iterations, the origin of time-tags for this date has been set to 2017-01-26T09:00:40.000000
$ cat /DATA/BEPI/DATA/RESETS.txt |grep ^2017-01-26
2017-01-26 2017-01-26T09:00:40.000000 SDT
MEA2 data for 2017/01/26
Use of Geometric factor changes to synchronize .cml ⇒ HSK ⇒ SCI data
Commanding data
Extract MEA2.G_Factor macro commands from procedure files (.cml)
$ cat /DATA/BEPI/WWW/documents/TESTS/PROCEDURE/20170126-0001.cml |grep G_Factor | grep MEA2
T 17-01-26 14:52:25.9 *   * * 2236  . MEA2.G_Factor        0x01
E 17-01-26 14:52:25.9 * 1 * * 2236  . MEA2.G_Factor        0x01
T 17-01-26 14:57:01.2 *   * * 2247  . MEA2.G_Factor        0x02
E 17-01-26 14:57:01.2 * 1 * * 2247  . MEA2.G_Factor        0x02
T 17-01-26 14:57:55.4 *   * * 2258  . MEA2.G_Factor        0x03
E 17-01-26 14:57:55.4 * 1 * * 2258  . MEA2.G_Factor        0x03
T 17-01-26 14:58:50.4 *   * * 2269  . MEA2.G_Factor        0x04
E 17-01-26 14:58:50.4 * 1 * * 2269  . MEA2.G_Factor        0x04
HK data
The following command parse the CDF L1 HSK file to display changes in first_cmd_exe, filtering commands 0x0801..0x804
$ python command.py MEA2 2017-01-26 | grep 080[1-4]
R000204 2017-01-26 14:52:25.781250     0801
R000221 2017-01-26 14:56:57.781250     0802
R000225 2017-01-26 14:58:01.781250     0803
R000228 2017-01-26 14:58:49.781250     0804
SCI data
The geom_factor value (1,2,4,8) could be found in OMN and 3D data
$ python -m geom_factor MEA2 2017-01-26
FILE : /DATA/BEPI/DATA/L1/20170126/MEA2_L1_OMN_16E__20170126_V00.cdf  720 records
R000000 2017-01-26 13:47:51.761719     0000
R000540 2017-01-26 14:52:20.962891     0001
R000606 2017-01-26 14:56:54.082031     0002
R000619 2017-01-26 14:57:47.878906     0004
R000633 2017-01-26 14:58:45.814453 0008|
|
A small difference of ~5s remains between HK and SCI data. geom_factor change in SCI data some seconds before HK command !!! |
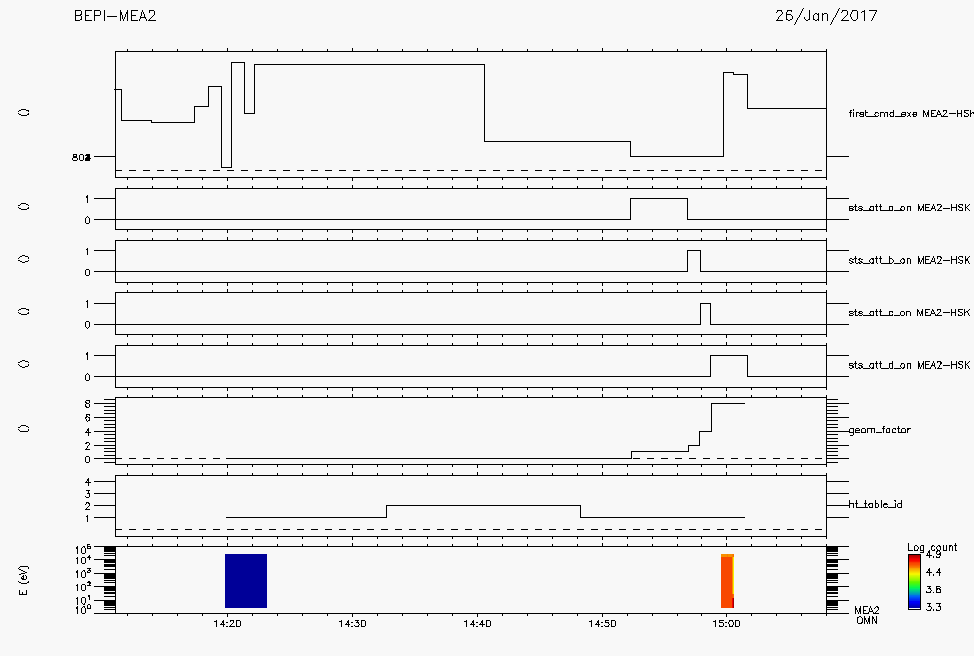
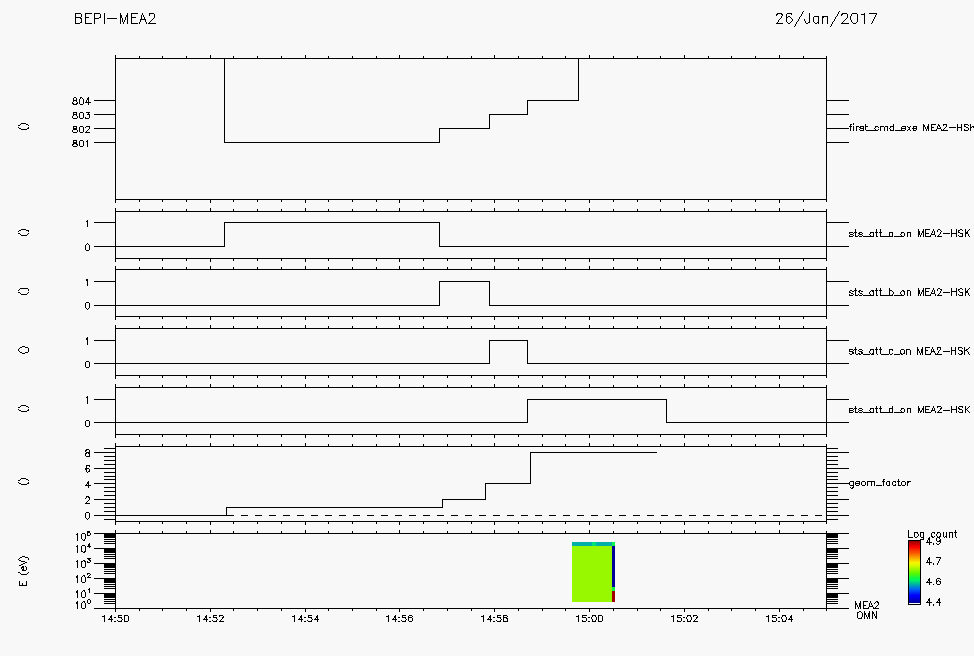
Geometric factor changes
We can see a good accuracy between HK and SCI data, corresponding with commanding time-tags.
Following plot contains several panels :
-
first_cmd_exe extracted from CDF L1 HSK file
(values displayed 0x801 to 0x804) -
4 panels for each GF (1/2/3/4)
-
geom_factor panel extracted for CDF L1 OMN_16E/OMN_32E/OMN_64E
-
CDF L1 OMN spectrogram
Energy Table changes discrepancy
However, adding a panel to plot energy-table changes, we can see some change on table :
-
table #2 from 14:32:50 to 14:48:23
But we don’t see any changes on commanding panel (first_cmd_exe)!!!